Reviewing Webhook Logs
Once your webhook is created in Apps, you may review its logs by selecting it from the Apps list.

Log Entries
You will be navigated to the webhook's edit screen. You will find Logs below the Edit Webhook section.
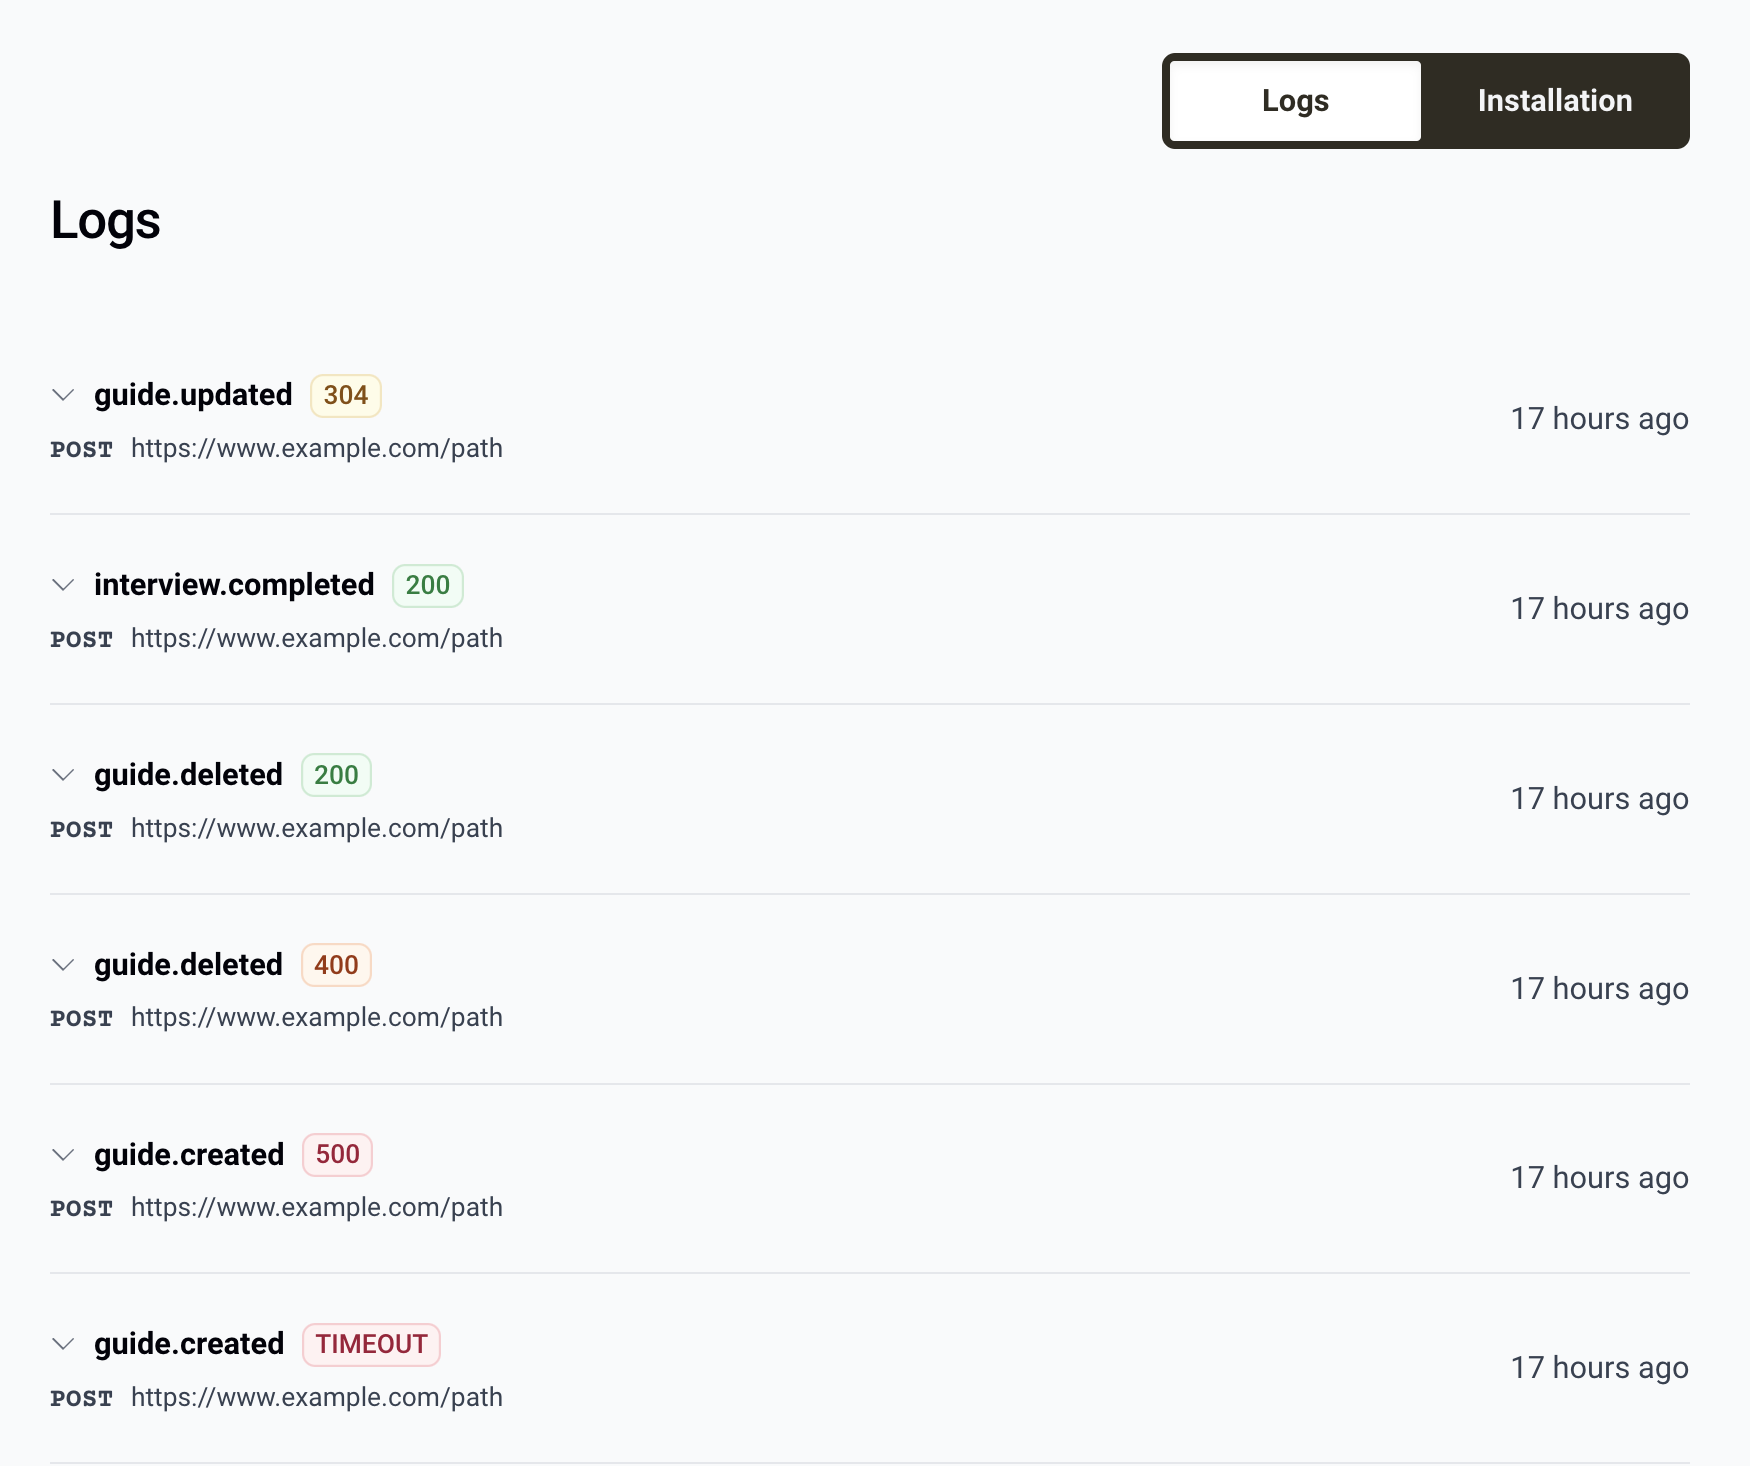
Each log entry includes the event name, the response status code, the time it was sent, the endpoint it was sent to, and the full event payload.
The events listed will depend on which events you configured to trigger the webhook.
The status code badge displays the HTTP response code that was returned by the endpoint's server. TIMEOUT indicates the server failed to make a connection in a timely manner.
Vamp expects a 200 status code to be returned from the webhook endpoint. In the event a 200 status is not returned or the connection times out, Vamp will try to send the webhook again in two-minute intervals for up to ten minutes.
Webhook log entries are deleted after five days.
Webhook Payload
Select the event name to expand the listing and reveal the webhook payload. The payload will contain a JSON object with this format:
{
  "event" : "EVENT_NAME"
  "object" : "OBJECT_NAME"
  "OBJECT_NAME" : {
    ...OBJECT_DATA
  }
}
For example:
{
  "event" : "guide.created"
  "object" : "guide"
  "guide" : {
    "id": "01jpnf7a0zwp4r55nwjs95hfr3",
    "url": "https:\/\/vamp.bot\/i\/c327cb4a-40f6-4516-be61-e6e064d18f09",
    "name": "EarBuds Product Feedback",
    ...
  }
}
The full GuideResource and InterviewResource objects can be found in Vamp's API Documentation.